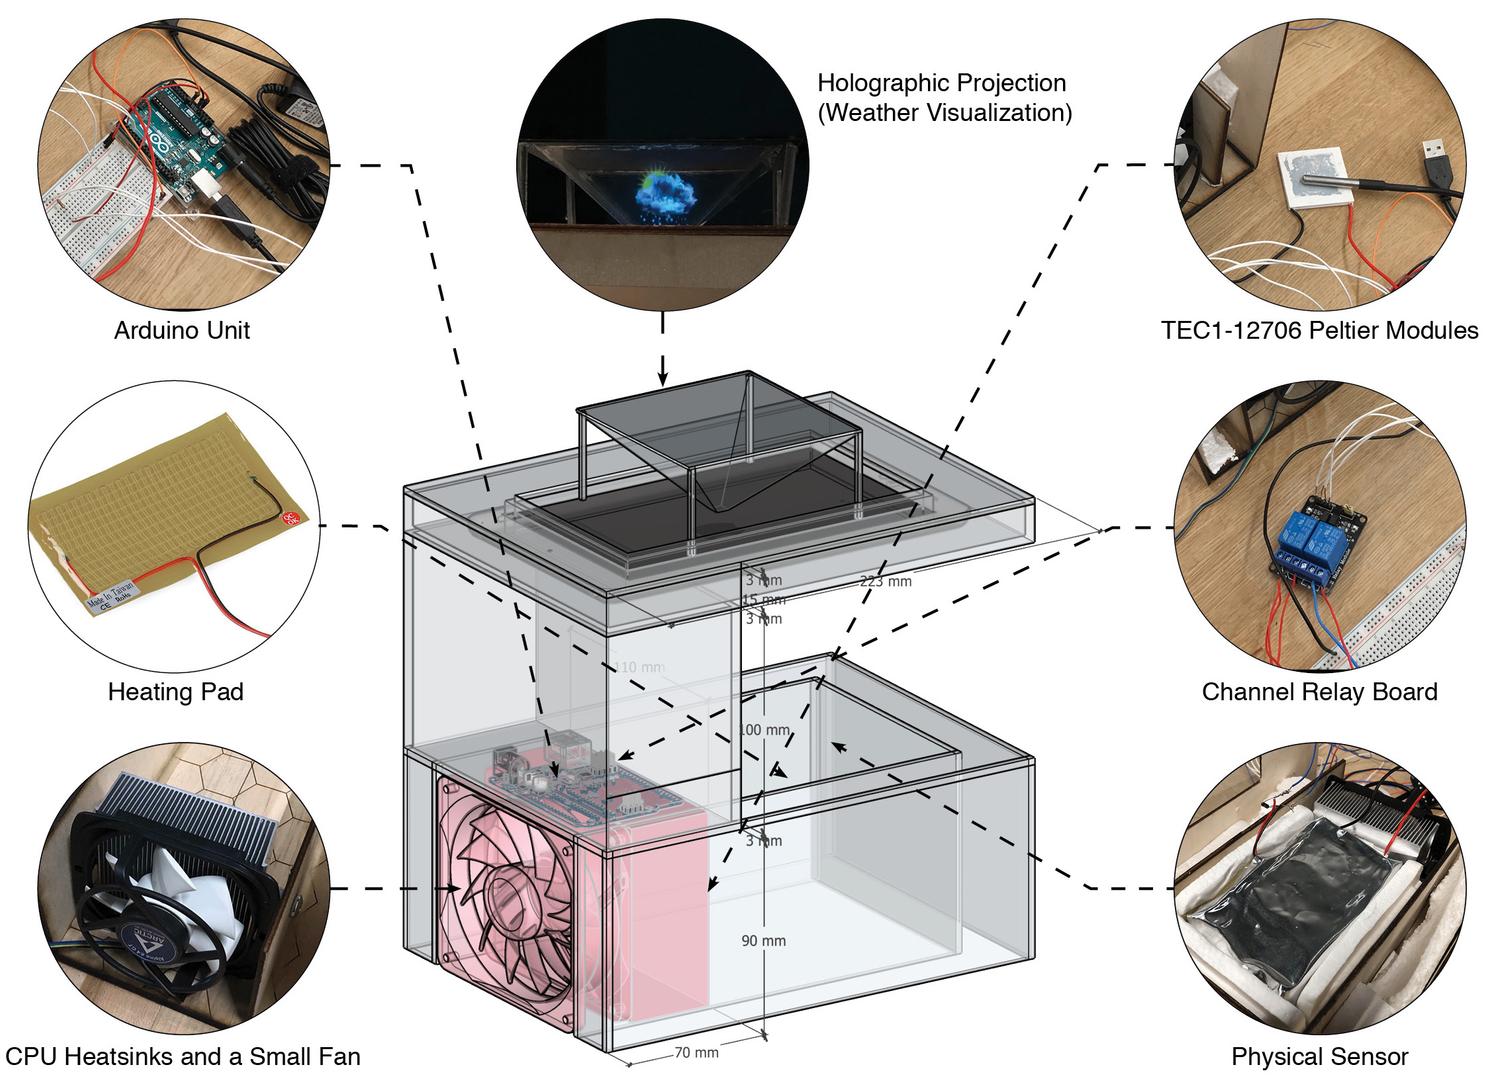
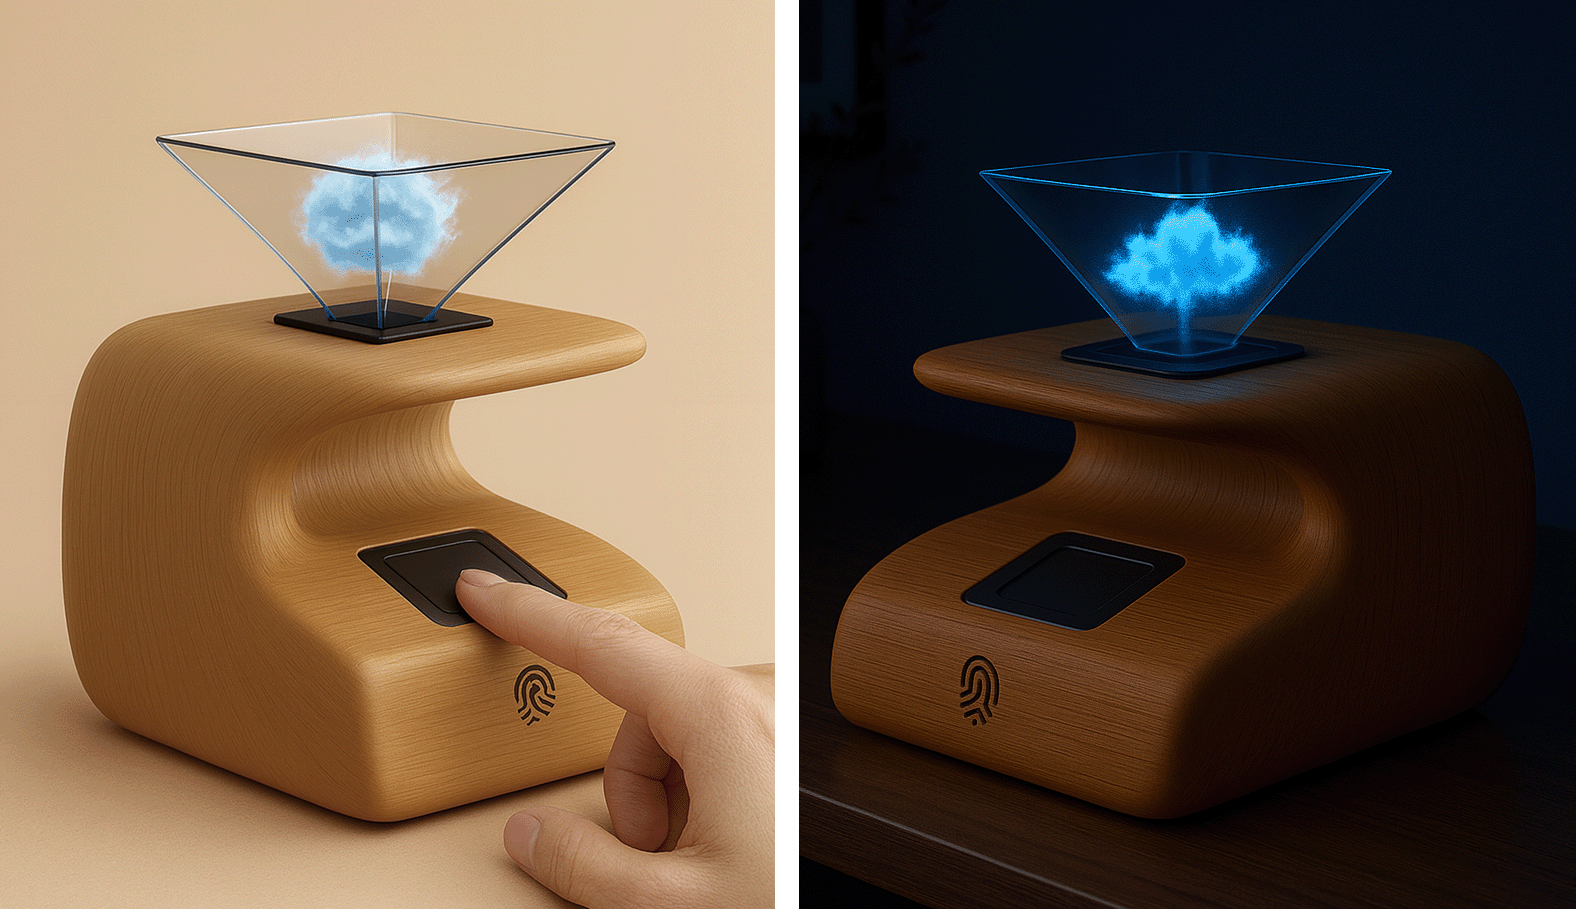
FELLIT
| Tools: Arduino; Javascript
| Brief Introduction
Have you ever realized it’s too cold only after leaving home? Or
felt frustrated about what to wear, even after checking the weather
forecast? To address these everyday challenges, I created a device
called
FEELIT—designed to
help people feel the outdoor conditions through tangible
temperature and immersive weather visualization.
FEELIT consists of two main components: The upper part uses
holographic projection technology to visually display the current
weather. The lower part features an aluminum shim that users can
touch to physically sense the outdoor temperature—offering a more
intuitive experience than simply reading numbers.
More Details
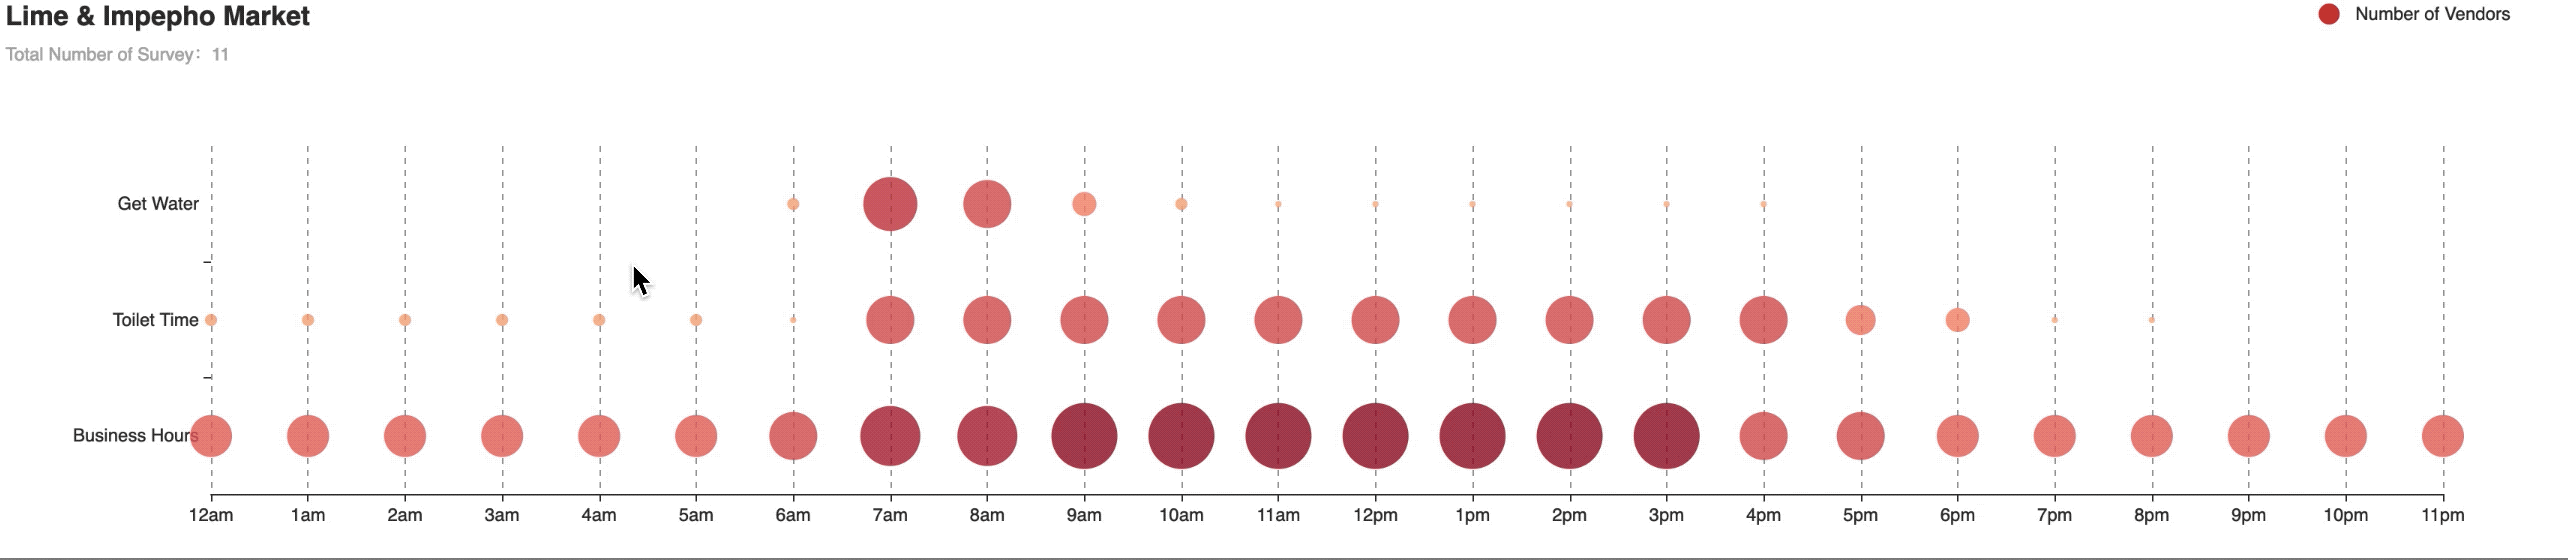
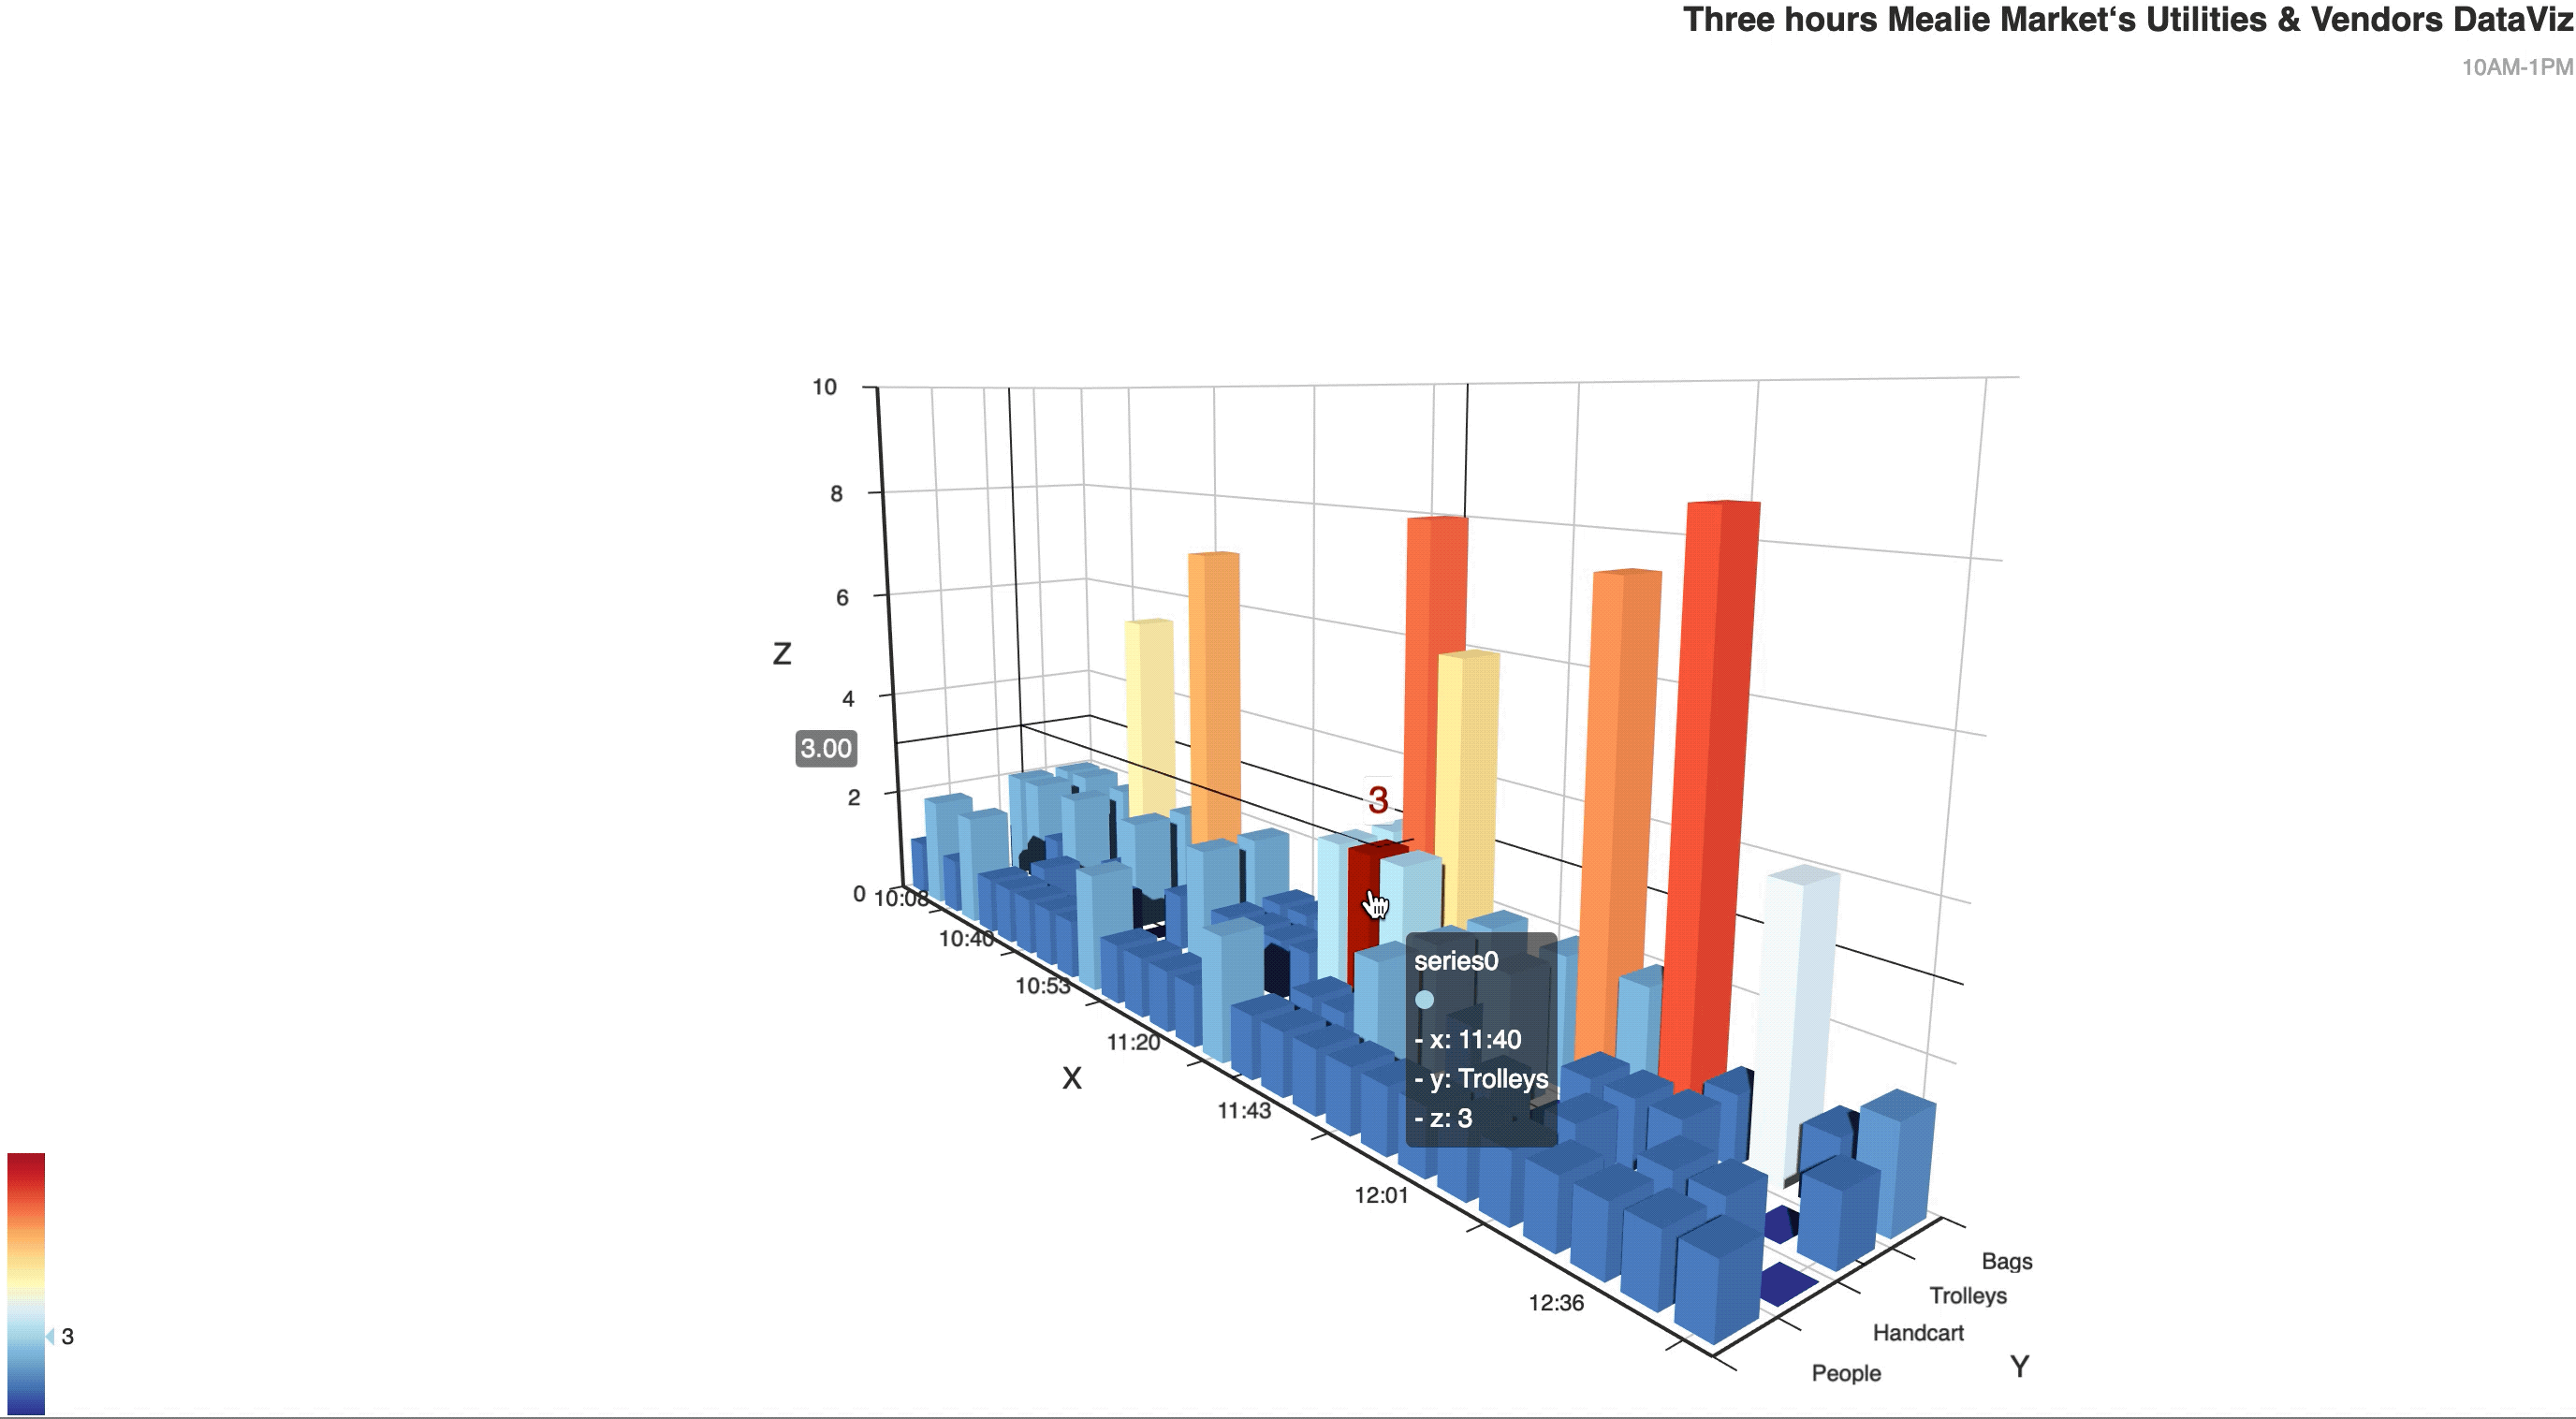
Data Visualization: Market Vendors in Durban, South Africa
| Tools: Echarts(Java); Tableau
| Brief Introduction
Durban is one of the few cities in the world actively trying to
integrate informal economies within its urban development
frameworks. Durban’s current street trader sites diversify the
spectrum of commercial property in very important ways — they offer
both a lower cost rent to traders and also a much smaller footprint.
WHY?
The purpose of the study is to better understand the urban informal
economy and find out how cities integrate the informal economy.
By working with communities to gather, analyze and visualize data,
we could in-depth understand vendors’ living condition and we are
able to easily find out the existing problems. Eventually, we could
help them build urban intelligence.